
TCP# 103: We had 47 dashboards. Nobody knew which one to open during an incident.
We fixed it by deleting 28 of them.

You can also read my newsletters from the Substack mobile app and be notified when a new issue is available.

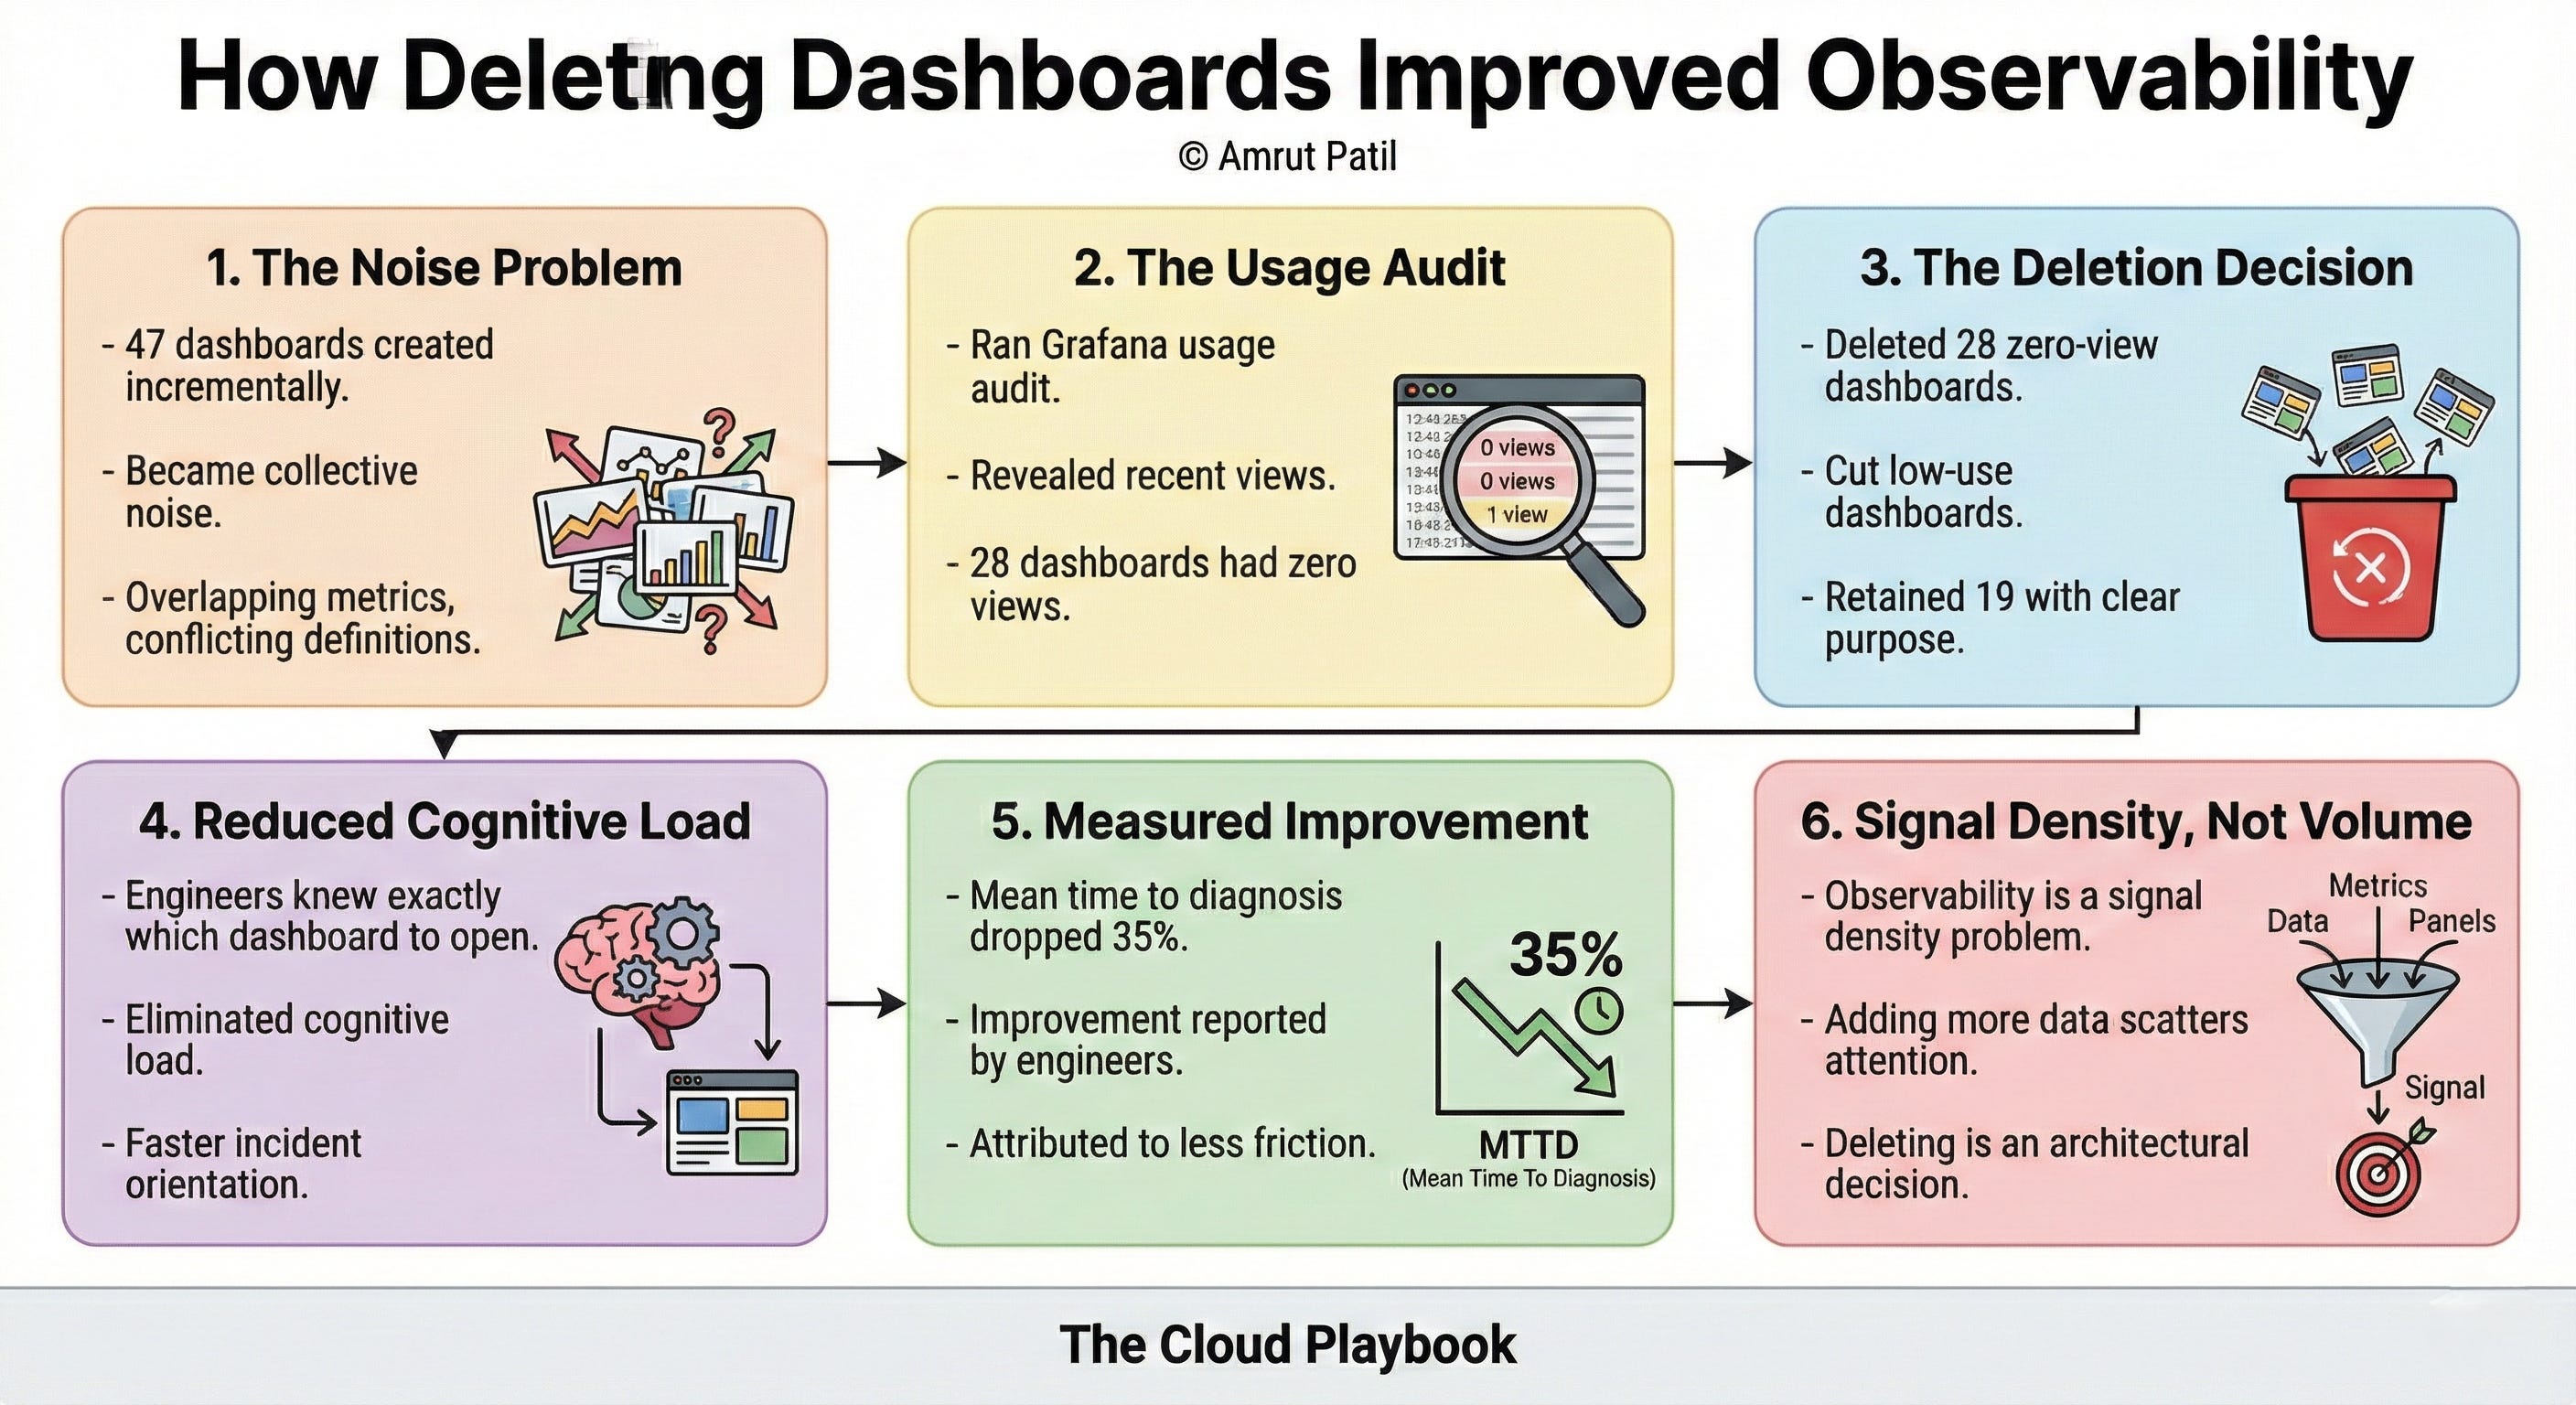
Eighteen months ago, we had 47 dashboards across our platform.
Engineers had built them incrementally, one incident at a time. Each one made sense when it was created.
Collectively, they had become noise.
We deleted 28 of them. No migration. No archiving strategy. Gone.
Observability improved within two weeks.
THE DECISION NOBODY WANTED TO MAKE
Before the deletion, every dashboard had a defender.
Someone built it. Someone remembered why. Deleting it felt like losing institutional knowledge, even if nobody had opened it in six months.
The instinct was to keep everything, refine it later, and consolidate someday.
Someday never came.
The dashboards multiplied instead. New services spun up. Engineers cloned existing dashboards and modified them. Naming conventions drifted.
By the time we audited, we had dashboards with overlapping metrics, conflicting definitions of the same signals, and no clear owner for most of them.
When an incident occurred, engineers opened dashboards at random, cross-referencing panels that told different stories.
The time to diagnosis stretched. Attention fractured across too many surfaces.
WHAT DELETION ACTUALLY PRODUCED
We ran a usage audit first.
Grafana logs showed which dashboards had been opened in the prior 90 days and by whom.
Twenty-eight dashboards had zero views. Eleven more had been opened once, by the person who created them.
We deleted the zero-view dashboards immediately. We reviewed the low-use group and cut all but three.
What remained: 19 dashboards with clear owners, consistent naming, and defined purposes.
Service health. Infrastructure cost. Deployment pipeline. Per-tenant SLA tracking.
Within two weeks, the on-call rotation reported faster incident orientation.
Not because the dashboards had better charts. Because engineers knew exactly which dashboard to open and what question each one answered.
The cognitive load of choosing dropped out of the incident response process entirely.
The mean time to diagnosis dropped 35% over the following quarter. That number came from incident retrospectives, not tooling. Engineers reported it themselves.
WHY THIS NEVER MADE IT INTO A RETRO
Nobody celebrated this work.
Deleting dashboards does not ship a feature. It does not close a ticket. It does not appear in a sprint demo.
The engineers who did the audit and ran the deletion spent two days on it. The output was absence, not presence. Fewer things, not more.
In most engineering cultures, that work is invisible.
It does not generate a Slack notification. It does not move a burndown chart. Leadership does not ask about it in planning.
The benefit showed up indirectly: faster incidents, less confusion, and cleaner on-call handoffs.
Those outcomes were credited to the teams that responded well, not to the people who removed the friction that slowed responses down.
SIGNAL DENSITY IS AN ENGINEERING DECISION
The instinct in observability is to add.
Add metrics. Add panels. Add dashboards. More data means more visibility.
That logic is wrong.
More data means more surface area for attention to scatter across.
Observability is not a volume problem. It is a signal density problem.
The question is not how much your platform can surface. It is how quickly an engineer on call at 2 am can move from alert to diagnosis to action.
Every dashboard that does not answer a specific question in a specific context is a tax on that process. The tax compounds across every incident, every rotation, every engineer new to the system.
Deleting 28 dashboards was not a cleanup task.
It was an architectural decision about what the platform communicates and to whom. That decision belongs to the platform team. It requires judgment about which signals matter, what noise looks like, and what engineers actually need when things break.
The Cloud Playbook publishes every Wednesday and Sunday. If your team is drowning in dashboards nobody opens, forward this to the person who owns your observability stack.
P.S. This article is part of a deeper series on observability. Paid readers get the full implementation kit.
Whenever you’re ready, there are 2 ways I can help you:
Free guides and helpful resources: https://thecloudplaybook.gumroad.com/
Get certified as an AWS AI Practitioner in 2026. Sign up today to elevate your cloud skills. (link)
That’s it for today!
Did you enjoy this newsletter issue?
Share with your friends, colleagues, and your favorite social media platform.
Until next week — Amrut
Get in touch
You can find me on LinkedIn or X.
If you would like to request a topic to read, please feel free to contact me directly via LinkedIn or X.