
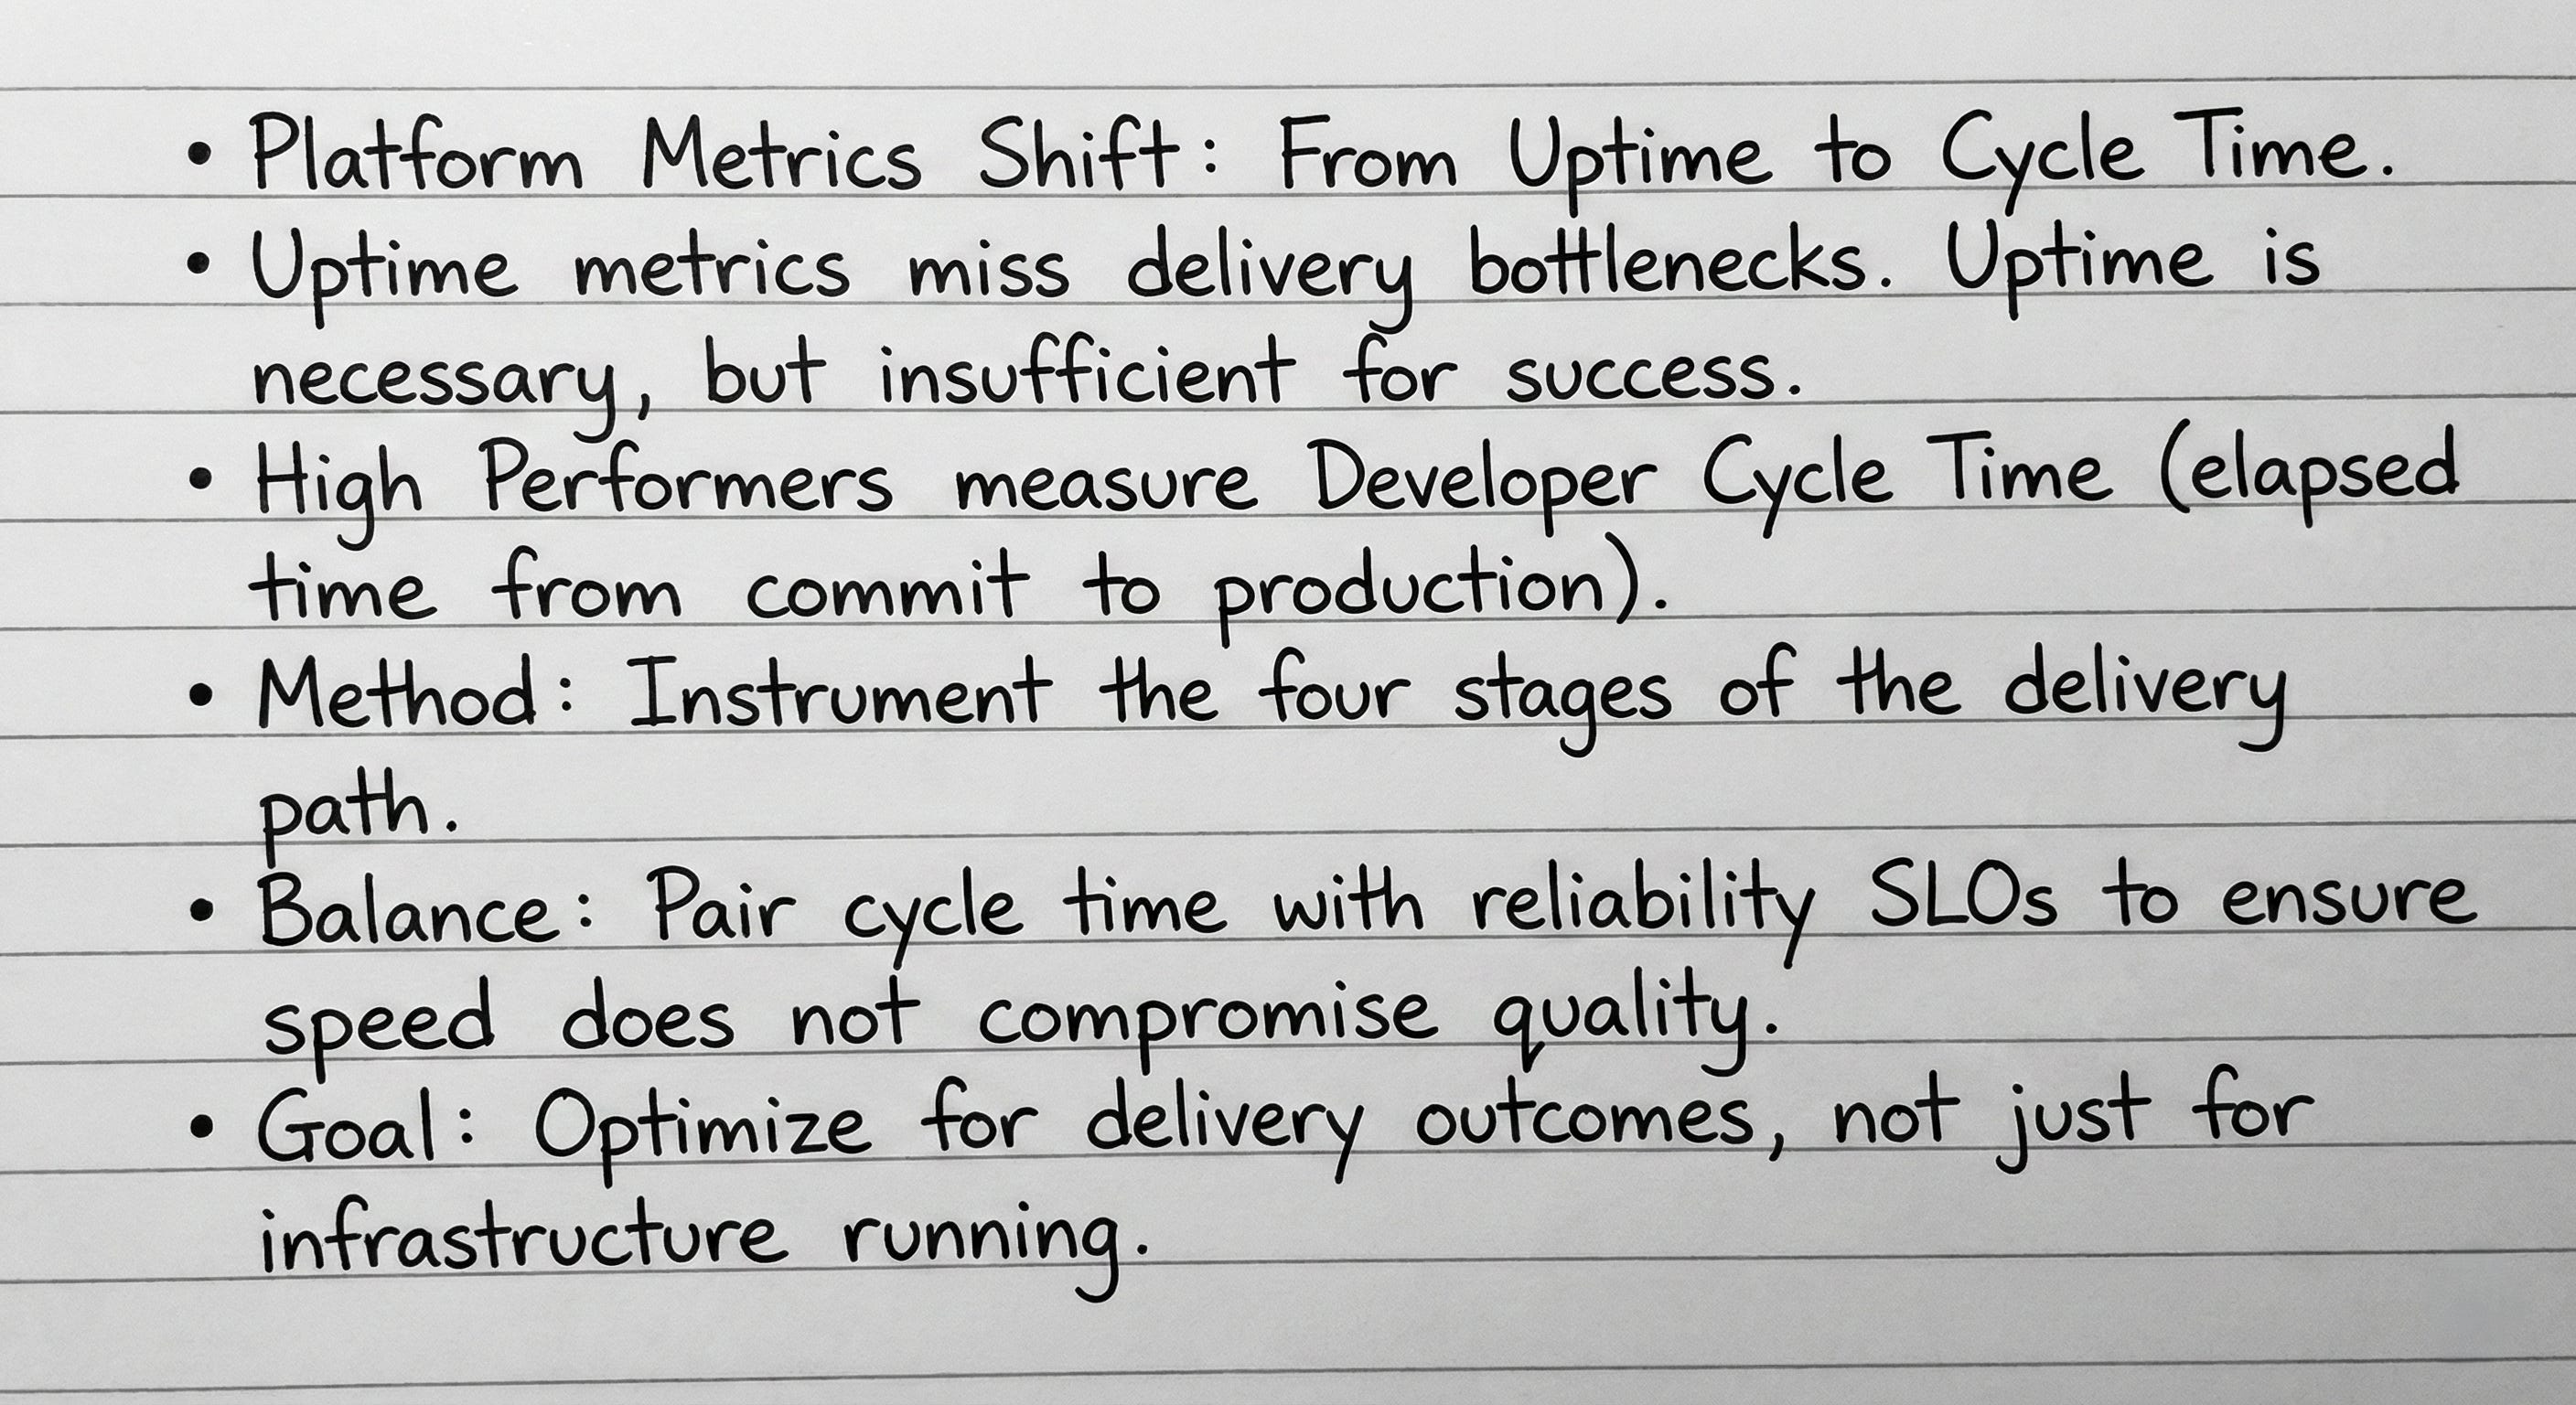
TCP #97: Your platform has 99.9% uptime. Your engineers still can't ship
Uptime metrics show green dashboards while PR queues grow. High performers measure cycle time instead. Here's why.

You can also read my newsletters from the Substack mobile app and be notified when a new issue is available.

Platform teams report SLO compliance in leadership reviews.
99.9% availability on the CI system. 99.95% on the deployment pipeline. Zero customer-impacting incidents this quarter.
Leadership sees green dashboards. The platform looks healthy. Investment continues.
Meanwhile, PR queues grow longer.
Code review takes two business days. Merge to deploy takes another day because release windows happen twice weekly. Deployments take 45 minutes because teams batch changes to protect the on-call rotation.
Engineers complain about slow delivery.
Platform teams point to uptime metrics. The metrics show the platform is working. The engineers are wrong.
The engineers are correct.
Uptime measures service continuity. A platform outage blocks all work. Availability matters. No one disputes this.
The problem emerges when uptime becomes the primary success metric.
Uptime reports whether the system is running. It ignores the time engineers spend waiting in the delivery path.
Teams optimize for what they measure.
Platform teams measure uptime and optimize uptime. They add redundancy. They reduce change frequency. They implement approval gates to prevent incidents.
Each optimization improves availability.
Each optimization increases cycle time.
Uptime increases. Throughput decreases.
The platform succeeds on paper. Product delivery fails in practice.
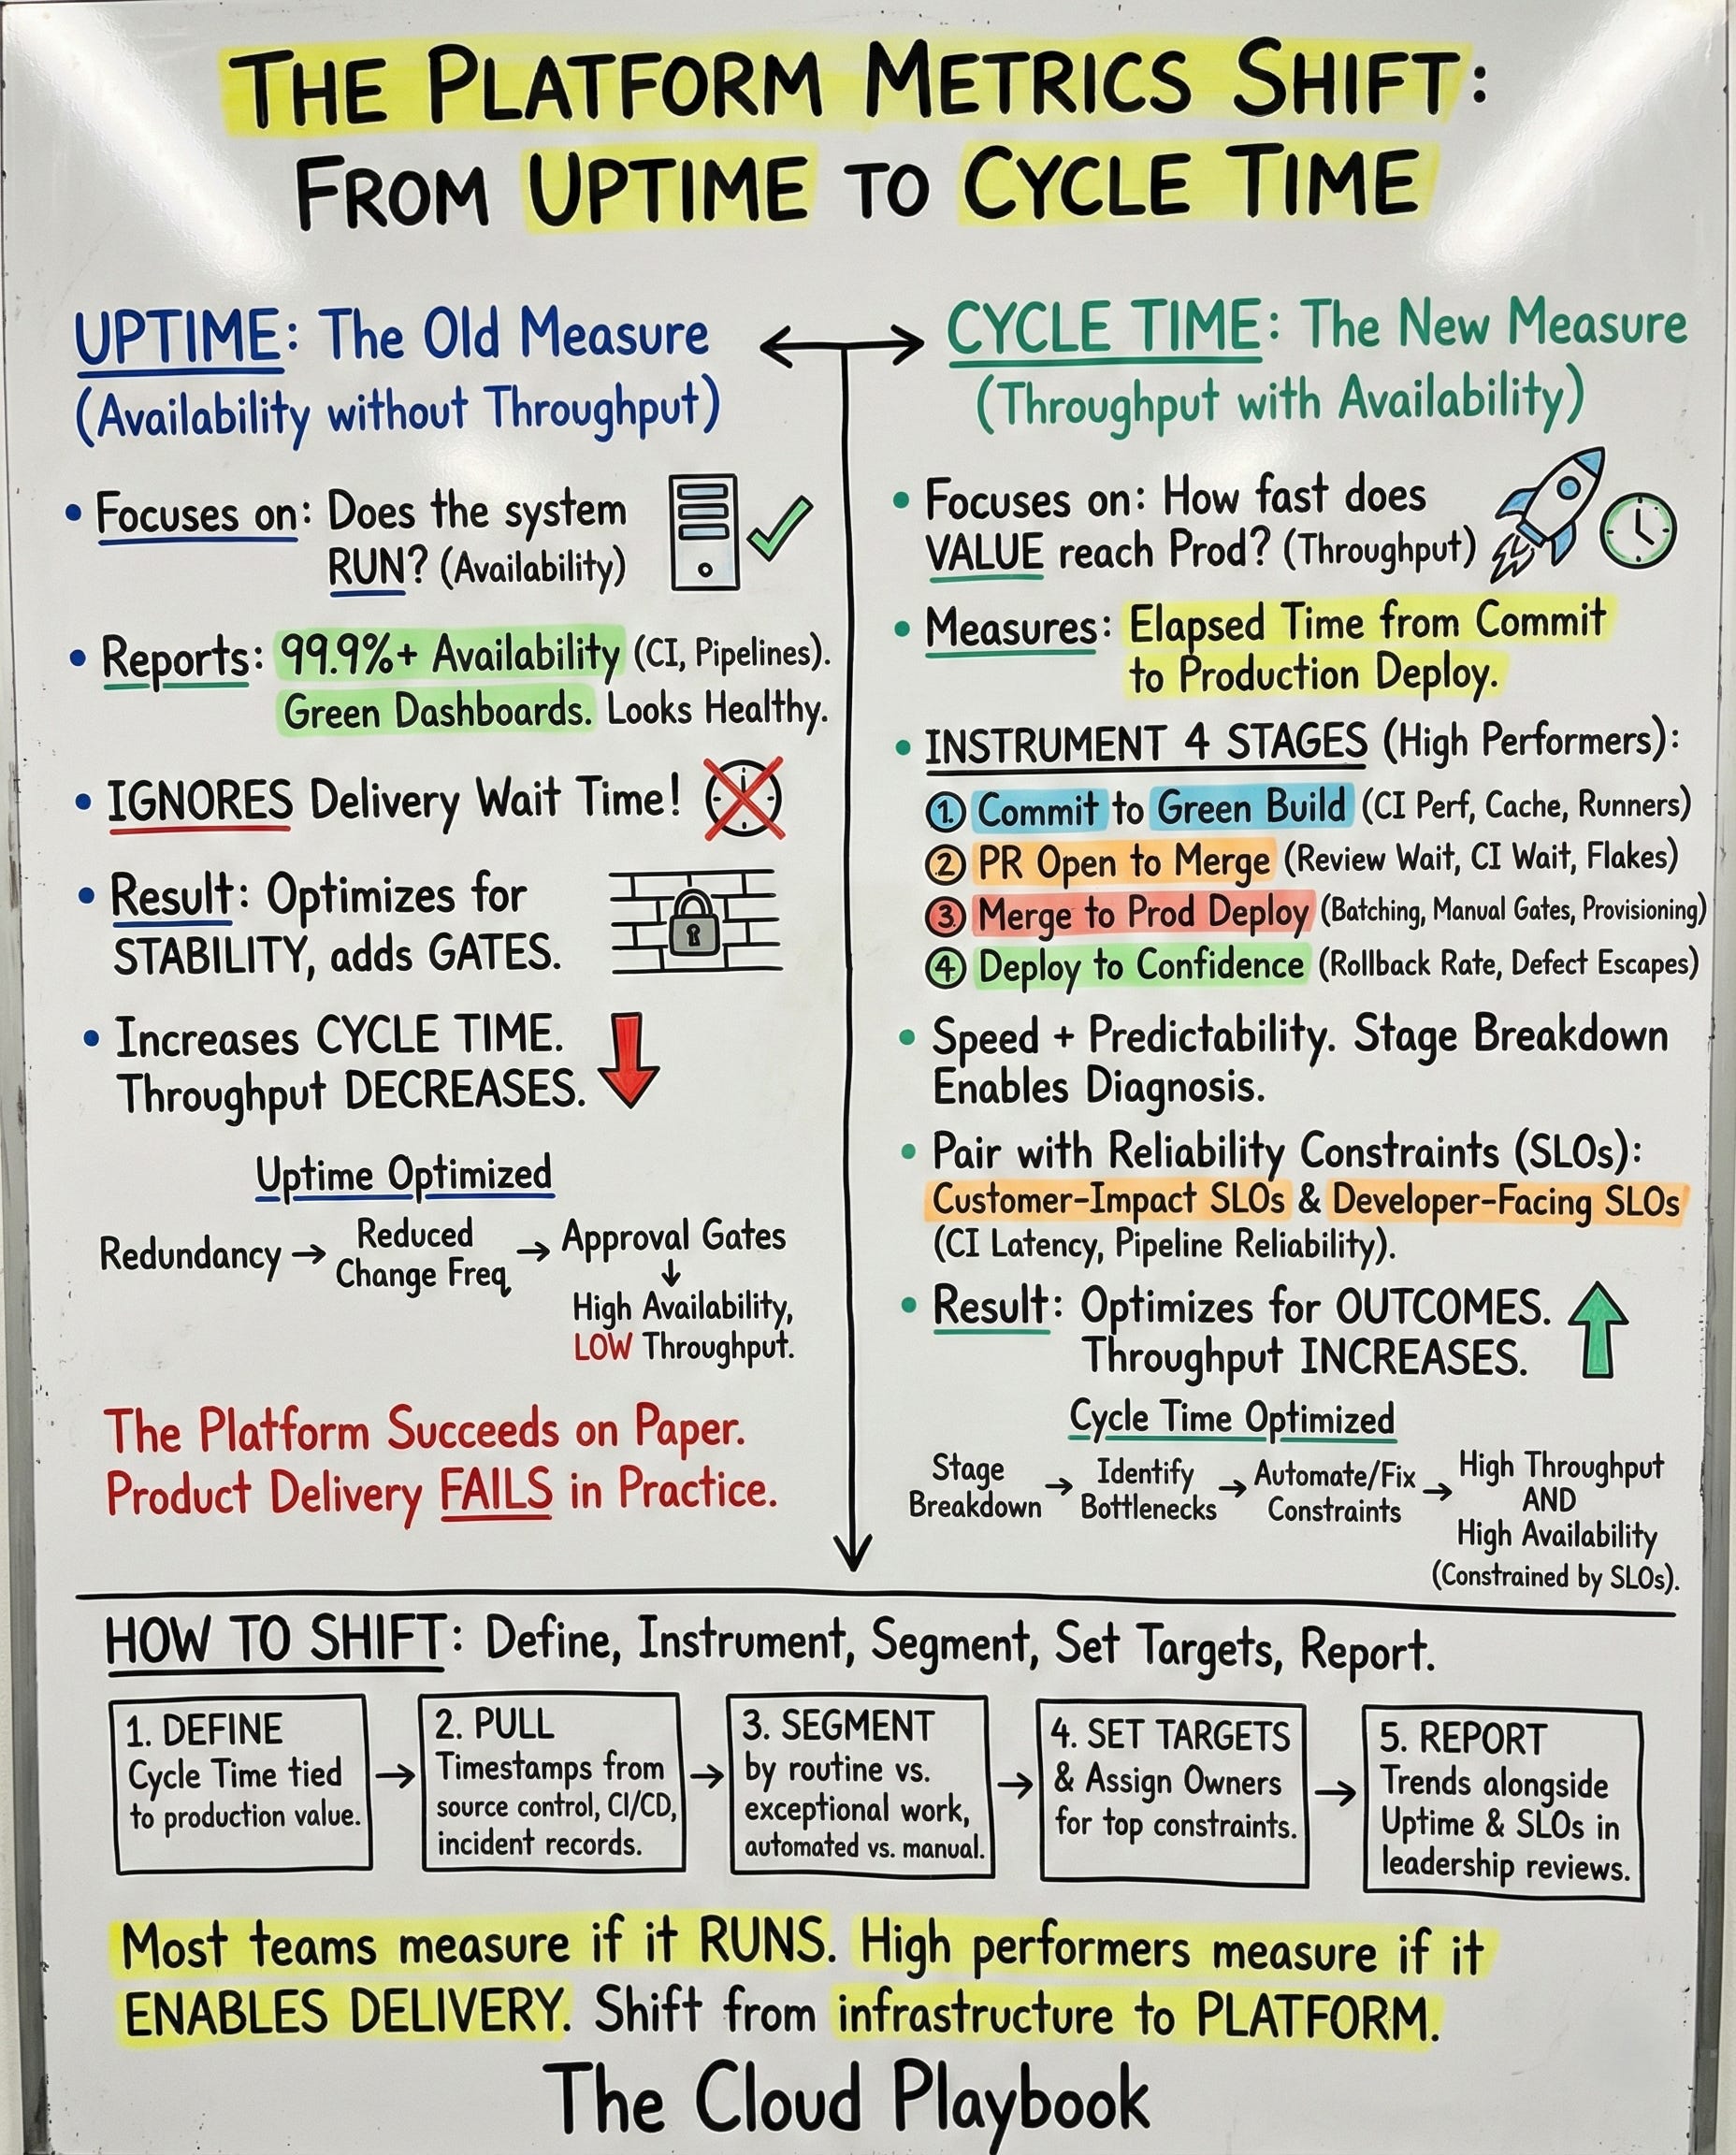
High Performers Measure Developer Cycle Time Across Stages
High-performing platform teams measure developer cycle time.
They define it as the elapsed time from the first commit to the production deploy via the standard workflow.
They identified four stages.
Commit to green building.
This captures CI performance. Runner speed. Cache efficiency. Dependency resolution time. The metric drives infrastructure investment decisions.
PR open to merge.
This splits into review wait and CI wait. Review wait reveals reviewer load and decision latency. CI wait reveals throughput limits and flake rate. Different causes require different fixes.
Merge to production deploy.
This exposes the batching policy, manual change control, environment provisioning delays, and the quality of deploy automation. The stage makes coordination costs visible.
Deploy to confidence.
This tracks the rollback rate, defect escapes, time to detect regression, and time to complete rollback. The metric prevents teams from trading quality for speed.
Speed is easy. Predictability is hard. I build platforms that deliver both.
One number hides causes. Stage breakdown enables diagnosis.
Each stage has an owner. Each owner has a target. Escalation follows missed targets.
High performers pair cycle time with reliability constraints.
They maintain customer-impact SLOs for platform services. They track error budget burn. They treat SLO misses as production risk.
They add developer-facing SLOs.
CI availability and latency. Provisioning latency. Deployment pipeline reliability. Rollback readiness.
These SLOs protect engineers the way customer SLOs protect users.
The combination creates accountability.
Cycle time measures throughput. SLOs constrain how throughput gets achieved. Teams cannot sacrifice reliability for speed. They must deliver both.
Why Uptime Metrics Miss Platform Delivery Bottlenecks
A platform team reports 99.95% uptime on their CI system.
Pipeline execution takes 25 minutes. Build takes 10 minutes. Tests take 8 minutes. Deploy plus smoke checks takes 7 minutes.
The numbers look acceptable.
Cycle time tells a different story.
PR is open to merge averages two business days. Merges to deploy take an average of one business day. Total cycle time is three business days plus 25 minutes.
The pipeline contributes 25 minutes.
The organization contributes three days.
The team optimizes the pipeline. They add faster runners. They improve caching. They parallelize tests.
Pipeline time drops to 18 minutes.
Cycle time drops to three business days plus 18 minutes.
The constraint is unchanged.
High performers instrument the full path.
They discover PR review takes two days because reviewers carry product work. They discover merge to deploy takes one day because releases happen twice weekly to protect on-call schedules.
They fix the constraints.
They dedicate review capacity. They automate the deployment of safety checks. They eliminate release windows.
Cycle time drops to four hours.
The platform enables daily deployments. Product velocity increases. The team ships features weekly instead of monthly.
Uptime stays at 99.95% in both scenarios.
The first team reports success. The second team delivers success.
The difference is in measurement.
Uptime measures availability. Cycle time measures throughput. Availability without throughput is infrastructure. Throughput with availability is a platform.
How to Shift From Uptime to Cycle Time Instrumentation
Define cycle time in one sentence tied to production value.
Start with commit to production for changes shipped through the standard workflow. Expand later if needed.
Pull timestamps from systems of record.
Source control for commit and merge events. CI systems for build completion. Deploy systems for production events. Incident records for rollback events.
Avoid manual reporting.
Segment the metric to reduce debate.
Separate routine change from exceptional work. Separate standard workflow from custom paths. Separate automated deploy from manual gates.
Segments speed decisions.
Replace approval gates with policy and evidence.
Approvals exist for risk control. Risk control comes from explicit policy, automated checks, audit trails, and exception paths.
Move checks earlier in the workflow for routine changes.
Set targets for the top constraints.
Pick three to five metrics linked to your longest delays. Build completion time. Flake rate. Provisioning time. Deploy duration. Rollback time.
Assign owners. Define escalation paths.
Report cycle time trends in leadership reviews.
Pair them with uptime, SLO compliance, and error budget burn. This links platform investment to both throughput and risk in one view.
Most teams measure whether the platform runs.
High performers measure whether the platform enables delivery.
The first approach optimizes infrastructure. The second approach optimizes outcomes.
Measure cycle time. Instrument stages. Fix constraints.
Whenever you’re ready, there are 2 ways I can help you:
Free guides and helpful resources: https://thecloudplaybook.gumroad.com/
Get certified as an AWS AI Practitioner in 2026. Sign up today to elevate your cloud skills. (link)
That’s it for today!
Did you enjoy this newsletter issue?
Share with your friends, colleagues, and your favorite social media platform.
Until next week — Amrut
Get in touch
You can find me on LinkedIn or X.
If you would like to request a topic to read, please feel free to contact me directly via LinkedIn or X.