
TCP #87: How Amazon Bedrock Transforms CloudWatch Log Analysis: From 6 Hours to 3 Minutes
Turn your log analysis nightmare into an AI-powered debugging advantage

You can also read my newsletters from the Substack mobile app and be notified when a new issue is available.

Last month, our API response times spiked 300%.
Error rates climbed. Customers started complaining.
The on-call engineer spent six grueling hours parsing through 10,000+ CloudWatch log entries, cross-referencing timestamps, and manually identifying patterns.
The root cause?
A database connection pool exhaustion triggered by a seemingly innocent deployment three hours earlier.
Six hours of human detective work for a problem that should have been obvious.
That crisis taught me something crucial: the future of debugging isn't about faster grep commands or better log formats. It's about AI-powered pattern recognition.
Why Traditional Log Analysis Is Broken
The Hidden Cost of Manual Log Parsing
Most engineering teams underestimate the actual cost of manual log analysis.
But you know what the real killer is?
Pattern blindness.
When you're staring at thousands of log entries, your brain starts filtering out crucial connections. You miss the cascading failures, the upstream dependencies, and the subtle correlations that explain the real story.
The CloudWatch Paradox
CloudWatch gives us incredible visibility into our systems. But that visibility becomes a curse when:
Log volume exceeds human processing capacity
Multiple microservices generate overlapping error patterns
Time-sensitive incidents require immediate root cause identification
Junior engineers lack the pattern recognition experience
We needed a solution that could process vast amounts of log data with the pattern recognition capabilities of a senior engineer—but in minutes, not hours.
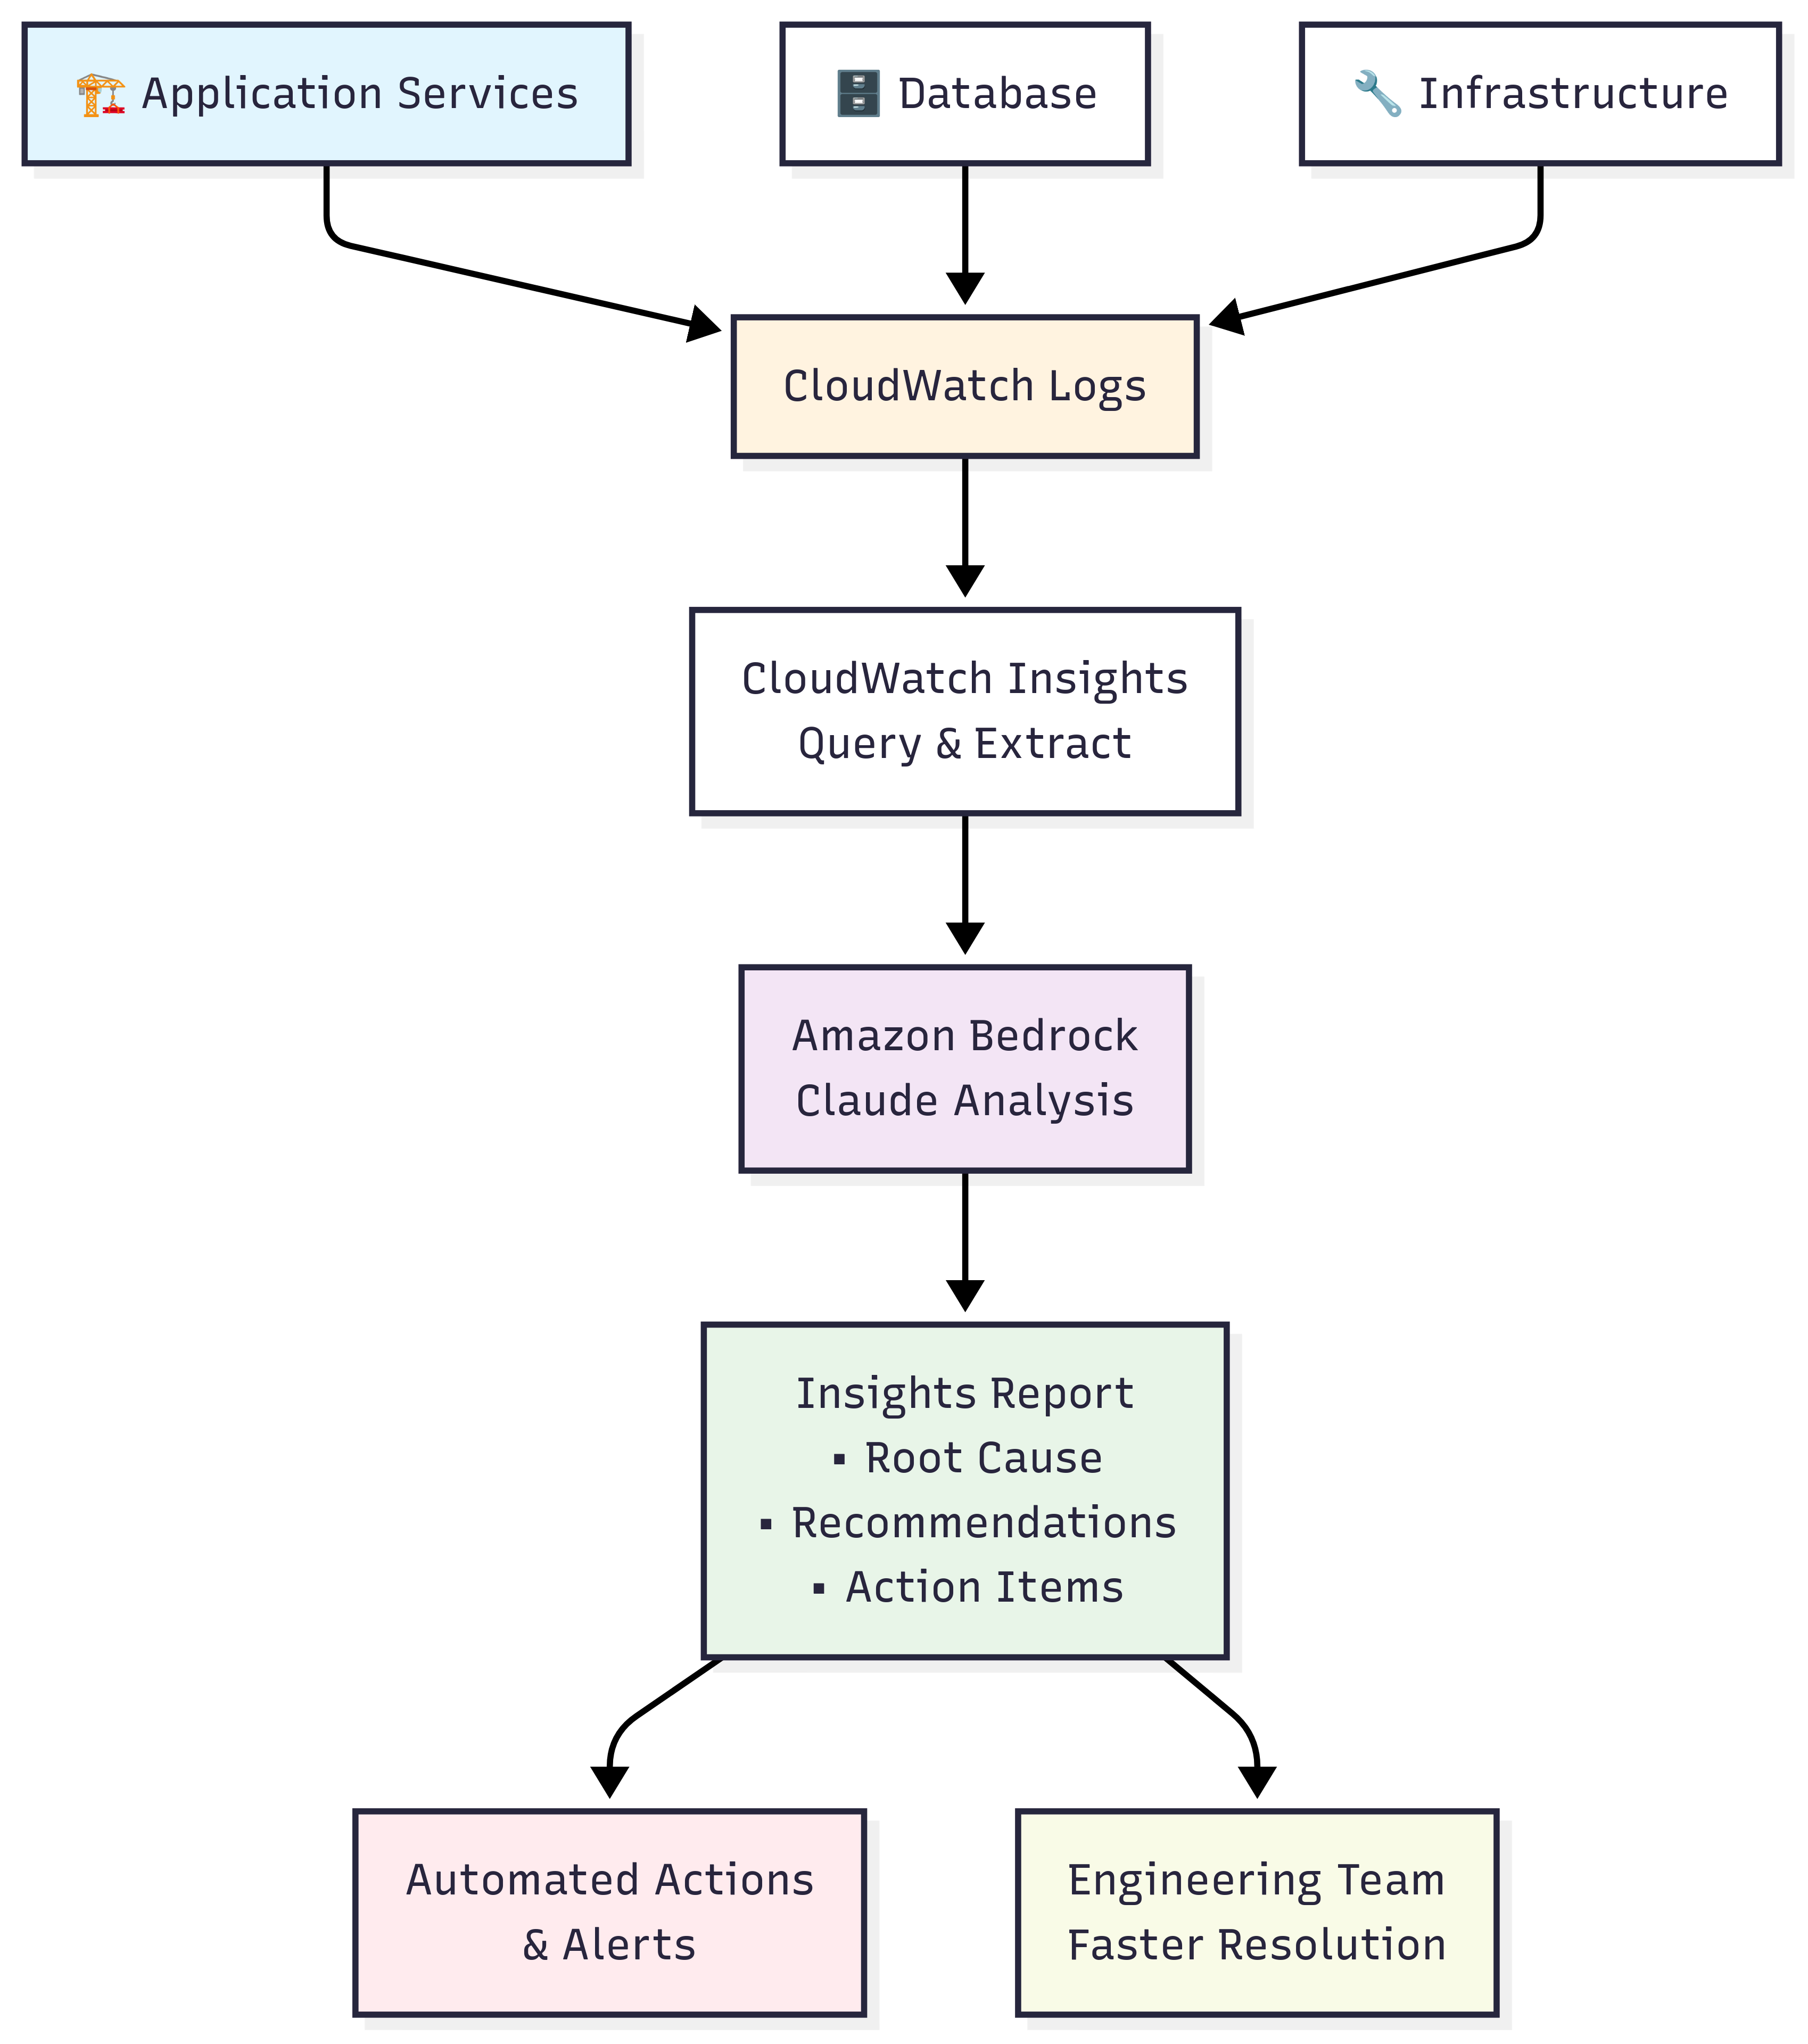
Enter Amazon Bedrock: Your AI-Powered Log Detective
Amazon Bedrock's Claude models excel at exactly what manual log analysis struggles with: finding meaningful patterns in vast amounts of unstructured text data.
Why Bedrock Works for Log Analysis
Context Understanding: Unlike simple keyword searches, Bedrock understands the relationships between different log entries, services, and timestamps.
Pattern Recognition: It identifies recurring error sequences, unusual user behavior patterns, and cascading failure chains that humans often miss.
Correlation Analysis: Bedrock connects seemingly unrelated events across different services, revealing root causes that are hidden within system complexity.
Actionable Insights: Instead of just highlighting problems, it provides specific recommendations based on common debugging patterns.
The Foundation: Setting Up CloudWatch Logs for AI Analysis
Log Structure That Works
Before feeding logs to Bedrock, ensure your log format supports pattern recognition:
[2024-01-15T14:32:21Z] [ERROR] [user-service] Connection timeout to database after 30s
[2024-01-15T14:32:21Z] [WARN] [auth-service] Retry attempt 3/3 for user ID 12345
[2024-01-15T14:32:22Z] [ERROR] [payment-service] Transaction failed: downstream service unavailable
Key elements:
Consistent timestamps (ISO 8601 format)
Clear service identifiers
Structured error levels
Contextual information (user IDs, transaction IDs, retry counts)
CloudWatch Insights: Your Data Extraction Tool
Use CloudWatch Insights to extract targeted log segments for Bedrock analysis:
fields @timestamp, @message, @log
| filter @message like /ERROR|WARN|TIMEOUT/
| filter @timestamp >= "2024-01-15T14:00:00"
| filter @timestamp <= "2024-01-15T15:00:00"
| sort @timestamp desc
| limit 1000
Pro tip: Focus on error spikes and unusual patterns rather than sending entire log streams to Bedrock. This reduces costs and improves the quality of analysis.
The Bedrock Analysis Framework: From Raw Logs to Actionable Insights
Step 1: Strategic Log Extraction
Don't dump everything into Bedrock. Use these extraction strategies:
Time-boxed Analysis: Focus on specific incident timeframes
Service-specific Queries: Analyze related microservices together
Error-level Filtering: Prioritize ERROR and WARN messages
Pattern-based Extraction: Look for specific error codes or keywords
Step 2: Crafting Effective Bedrock Prompts
The quality of your analysis depends heavily on prompt engineering. Here's the framework that works:
Analyze these CloudWatch logs for [SERVICE_NAME] between [TIME_RANGE]:

[LOG_DATA]

Please provide:
1. Root cause analysis with confidence levels
2. Timeline of events leading to the issue
3. Correlation patterns between different log entries
4. Specific recommendations for resolution
5. Preventive measures to avoid recurrence

Context: This is a [PRODUCTION/STAGING] environment with [BRIEF_ARCHITECTURE_DESCRIPTION]
Critical elements:
Specific analysis requests instead of generic "analyze this"
Service context to help Bedrock understand your architecture
Structured output format for consistent results
Confidence levels to gauge the reliability of insights
Step 3: Multi-Stream Correlation Analysis
The real power emerges when analyzing multiple log streams simultaneously:
Application logs + Infrastructure logs: Correlate application errors with underlying resource constraints
Database logs + API logs: Identify connection pool issues, query performance problems
Load balancer logs + Service logs: Spot routing issues and service discovery problems
Send combined log data with this enhanced prompt:
Analyze these multi-service logs for correlation patterns:

APPLICATION LOGS:
[app_logs]

INFRASTRUCTURE LOGS:
[infra_logs]

DATABASE LOGS:
[db_logs]

Focus on: Cross-service dependencies, cascading failures, and upstream root causes.
Advanced Techniques: Maximizing Bedrock's Analytical Power
Automated Analysis Pipelines
Set up CloudWatch alarms that trigger automated Bedrock analysis:
Error Rate Threshold: When error rates exceed 5%, automatically extract and analyze logs
Performance Degradation: Response time increases >50% trigger correlation analysis
Resource Utilization Spikes: CPU/memory alerts initiate multi-stream log analysis
Custom Analysis Templates
Create prompt templates for common scenarios:
Database Performance Issues:
Focus on: Query execution times, connection pool utilization, lock contention patterns
Expected output: Performance bottleneck identification and optimization recommendations
Authentication Failures:
Focus on: Failed login patterns, rate limiting triggers, suspicious user behavior
Expected output: Security incident classification and response recommendations
Service Discovery Problems:
Focus on: Service registration/deregistration events, health check failures, routing anomalies
Expected output: Infrastructure stability assessment and scaling recommendations
Proactive Monitoring: Beyond Incident Response
Daily Intelligence Reports
Set up automated daily summaries:
Weekly CloudWatch Summary Request:
- Analyze error patterns from the past 7 days
- Identify trending issues before they become critical
- Recommend proactive infrastructure improvements
- Highlight unusual user behavior patterns
Capacity Planning Insights
Use Bedrock for forward-looking analysis:
Based on these performance logs, predict:
1. Likely bottlenecks in the next 30 days
2. Scaling requirements for projected growth
3. Infrastructure weaknesses under load
4. Optimization opportunities with highest impact
The Future of AI-Powered Operations
This is just the beginning. As AI models become more sophisticated, we'll see:
Predictive Issue Detection: AI that prevents incidents before they occur
Automated Resolution: Systems that fix common problems without human intervention
Intelligent Infrastructure: Self-optimizing systems based on usage patterns
Context-Aware Alerting: Notifications that include root cause analysis and fix recommendations
The teams that master AI-powered log analysis today will have a massive competitive advantage as systems become increasingly complex.
Your Next Steps
The choice is clear: continue burning engineering hours on manual log analysis, or embrace AI-powered insights that deliver results in minutes, not hours.
Start small: Pick one recurring incident type and set up Bedrock analysis
Scale systematically: Add more services and use cases based on early wins
Measure everything: Track time savings, faster resolution, and prevented incidents.
The question isn't whether AI will transform operations, it's whether your team will lead the transformation or get left behind.
Whenever you’re ready, there are 3 ways I can help you:
Want to build automated, AI-powered businesses without quitting your job? Join my free community: The AI Business Playbook
Free guides and helpful resources: https://thecloudplaybook.gumroad.com/
Get certified as an AWS AI Practitioner in 2025. Sign up today to elevate your cloud skills. (link)
That’s it for today!
Did you enjoy this newsletter issue?
Share with your friends, colleagues, and your favorite social media platform.
Until next week — Amrut
Get in touch
You can find me on LinkedIn or X.
If you would like to request a topic to read, please feel free to contact me directly via LinkedIn or X.