

Athena spend is one of the most diagnosable costs in a data platform.
It is also one of the least diagnosed.
Athena charges based on data scanned. An analyst writes a query, gets the result, and moves on. The cost appears later as a line item with no obvious owner.
Then someone notices spend increased and asks the data team to investigate.
The data team looks at the total.
That is where the investigation usually stops.
The useful information is lower in the stack:
Which queries scanned the most?
Which tables were involved?
Which workgroup or principal submitted them?
Were they scheduled reports, dashboards, or exploratory queries?
Did partition pruning actually happen?
Athena exposes execution metadata, including bytes scanned and execution time, through query execution history and APIs. Persist that metadata, then turn it into a cost-management table.
Why Expensive Scans Compound
An unpartitioned or poorly partitioned table doesn't cost you once.
It costs you every time someone queries it.
The worst table is often not the largest table. Large tables frequently receive attention early because their size makes optimization obvious.
The more dangerous table is often medium-sized, convenient, and queried constantly.
It started small. Nobody partitioned it. It became central to reporting. Now every dashboard refresh scans the table again.
The result is not just higher cost.
It is wasted engineering attention. Without attribution, the response becomes a broad request for “everyone to optimize their queries.”
Broad requests produce shallow effort.
The actual fix is usually concentrated in two or three tables.
First, Create a Query History Table
The queries below assume you have a normalized table called:
platform_analytics.athena_query_history
With columns such as:
query_execution_idsubmitted_atquery_textprincipalworkgroupdata_scanned_bytesexecution_time_msreferenced_table
referenced_table should contain one row per table referenced by a query. A query that touches three tables should produce three history rows with the same query execution ID.
Do not pretend native query history is a permanent warehouse. Persist it to [internal] or another governed store if you need longer-term analysis.
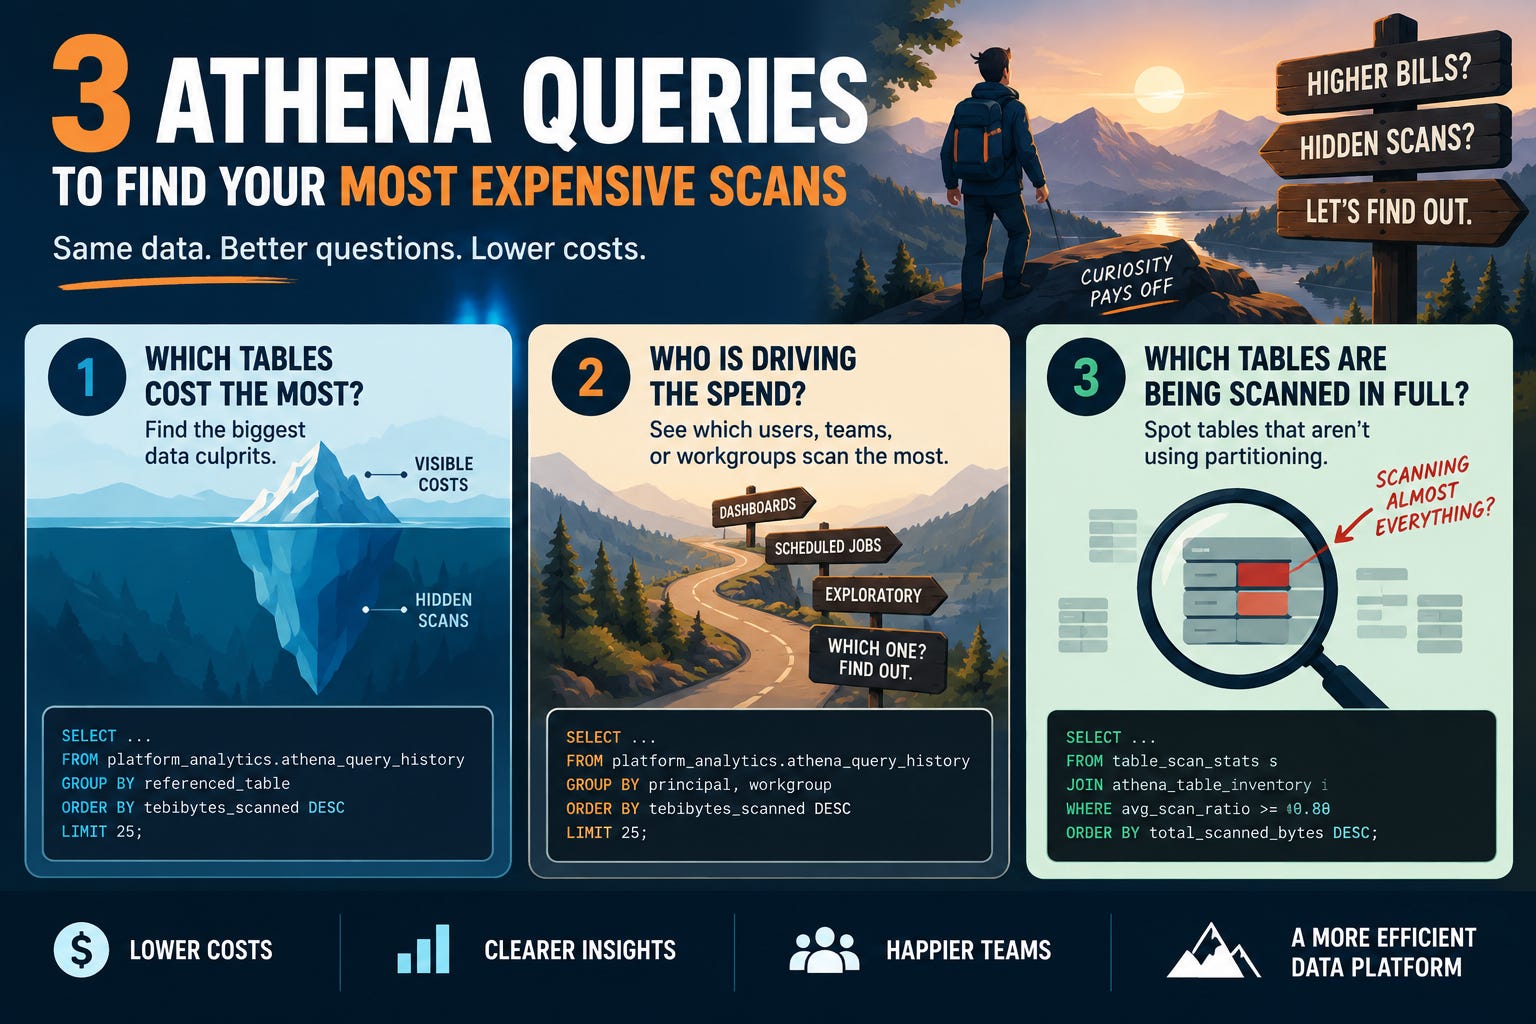
Query 1: Which Tables Drive Total Scan Volume?
SELECT
    referenced_table,
    COUNT(DISTINCT query_execution_id) AS query_count,
    SUM(data_scanned_bytes) / POWER(1024, 4) AS tebibytes_scanned,
    AVG(data_scanned_bytes) / POWER(1024, 3) AS avg_gib_scanned
FROM platform_analytics.athena_query_history
WHERE submitted_at >= current_timestamp - INTERVAL '30' DAY
GROUP BY referenced_table
ORDER BY tebibytes_scanned DESC
LIMIT 25;
This ranks tables by aggregate scan volume over the last 30 days.
That is more useful than finding the single most expensive query. A table scanned moderately by hundreds of queries may cost more than one table scanned heavily once.
Start with the top three tables.
Do not optimize the entire lake.
Query 2: Who or What Is Driving the Spend?
SELECT
    principal,
    workgroup,
    COUNT(DISTINCT query_execution_id) AS query_count,
    SUM(data_scanned_bytes) / POWER(1024, 4) AS tebibytes_scanned,
    AVG(data_scanned_bytes) / POWER(1024, 3) AS avg_gib_scanned
FROM platform_analytics.athena_query_history
WHERE submitted_at >= current_timestamp - INTERVAL '30' DAY
GROUP BY principal, workgroup
ORDER BY tebibytes_scanned DESC
LIMIT 25;
This gives you attribution.
Not to assign blame.
To identify the type of fix required.
If scheduled dashboards dominate, optimize refresh queries and table design.
If one workgroup dominates, apply workgroup-level controls and review its consumers.
If exploratory users dominate, improve table documentation, examples, partition guidance, and query education.
The same cost requires different interventions depending on its source.
Query 3: Which Tables Are Being Scanned Almost in Full?
To run this query, maintain a second table with one row per table:
platform_analytics.athena_table_inventory
Required columns:
referenced_tabletable_size_bytes
WITH table_scan_stats AS (
    SELECT
        referenced_table,
        COUNT(DISTINCT query_execution_id) AS query_count,
        SUM(data_scanned_bytes) AS total_scanned_bytes,
        AVG(data_scanned_bytes) AS avg_scanned_bytes
    FROM platform_analytics.athena_query_history
    WHERE submitted_at >= current_timestamp - INTERVAL '30' DAY
    GROUP BY referenced_table
)
SELECT
    s.referenced_table,
    s.query_count,
    s.avg_scanned_bytes / POWER(1024, 3) AS avg_gib_scanned,
    i.table_size_bytes / POWER(1024, 3) AS table_size_gib,
    s.avg_scanned_bytes / NULLIF(i.table_size_bytes, 0) AS avg_scan_ratio
FROM table_scan_stats s
JOIN platform_analytics.athena_table_inventory i
    ON s.referenced_table = i.referenced_table
WHERE s.avg_scanned_bytes / NULLIF(i.table_size_bytes, 0) >= 0.80
ORDER BY s.total_scanned_bytes DESC;
A high ratio means queries are scanning most of the table on average.
That makes partitioning, file format, predicate use, or table redesign a likely optimization target.
The ratio is a screening signal, not proof. A full scan may be intentional for some workloads. Confirm the query patterns before changing the table.
What to Do With the Results
For each of the top three tables, record:
Owner
Primary consumers
Query count
Total bytes scanned
Average scan ratio
Partition scheme
File format
Most common predicates
Recommended fix
Expected completion date
Then choose one optimization queue.
Do not send the results to everyone with a request to “use Athena more efficiently.”
Assign one owner to each table and fix the highest-impact problem first.
The usual candidates are:
Add or repair partitioning
Convert text formats to columnar formats
Add date predicates to scheduled queries
Reduce dashboard refresh frequency
Separate raw and analytical tables
Create an aggregate table for repeated reporting
Move an unsuitable workload to another query engine
The first win should be measurable.
Compare bytes scanned before and after the change.
What to Measure Monthly
Track:
Total bytes scanned
p95 bytes scanned per query
Top five tables by scan volume
Top five principals or workgroups by scan volume
Number of tables with average scan ratio above 0.80
Athena cost per active analyst or consuming team
Time required to identify the owner of an expensive table
The goal is not to make every query cheap.
The goal is to stop paying repeatedly for the same avoidable waste.
Athena costs become manageable when you have attribution, owners, and a recurring review cadence.
Every expensive Athena environment has the same failure mode:
The data needed to diagnose the problem exists.
Nobody turns it into a queue.
Run the three queries today. Find the top three tables. Assign owners. Fix one before optimizing anything else.
That is how a mysterious line item becomes an operating metric.
That’s it for today!
Did you enjoy this newsletter issue?
Share with your friends, colleagues, and your favorite social media platform.
Until next week — Amrut
Get in touch
You can find me on LinkedIn or X.
If you would like to request a topic to read, please feel free to contact me directly via LinkedIn or X.