
TCP #67: The Lambda Production Monitoring Playbook
Your complete guide to bulletproof Lambda monitoring that prevents outages before they happen

You can also read my newsletters from the Substack mobile app and be notified when a new issue is available.

Become a Founding Member
As a founding member, you will receive:
Everything included in paid subscriber benefits + exclusive toolkits and templates.
High-quality content from my 11+ years of industry experience, where I solve specific business problems in the real world using AWS Cloud. Learn from my actionable insights, strategies, and decision-making process.
Quarterly report on emerging trends, AWS updates, and cloud innovations with strategic insights.
Public recognition in the newsletter under the “Founding Member Spotlight” section.
Early access to deep dives, case studies, and special reports before they’re released to paid subscribers.
Why Most Lambda Monitoring Fails in Production
Traditional monitoring treats Lambda functions like static servers—a fundamental mistake that leads to blind spots during traffic spikes.
Lambda's event-driven, ephemeral nature necessitates a distinct observability strategy.
73% of Lambda production issues stem from concurrency limits and cold starts during unexpected traffic bursts. Yet most teams only monitor basic error rates and duration averages.
Today, we're diving deep into a monitoring strategy that transforms reactive fire-fighting into proactive optimization.
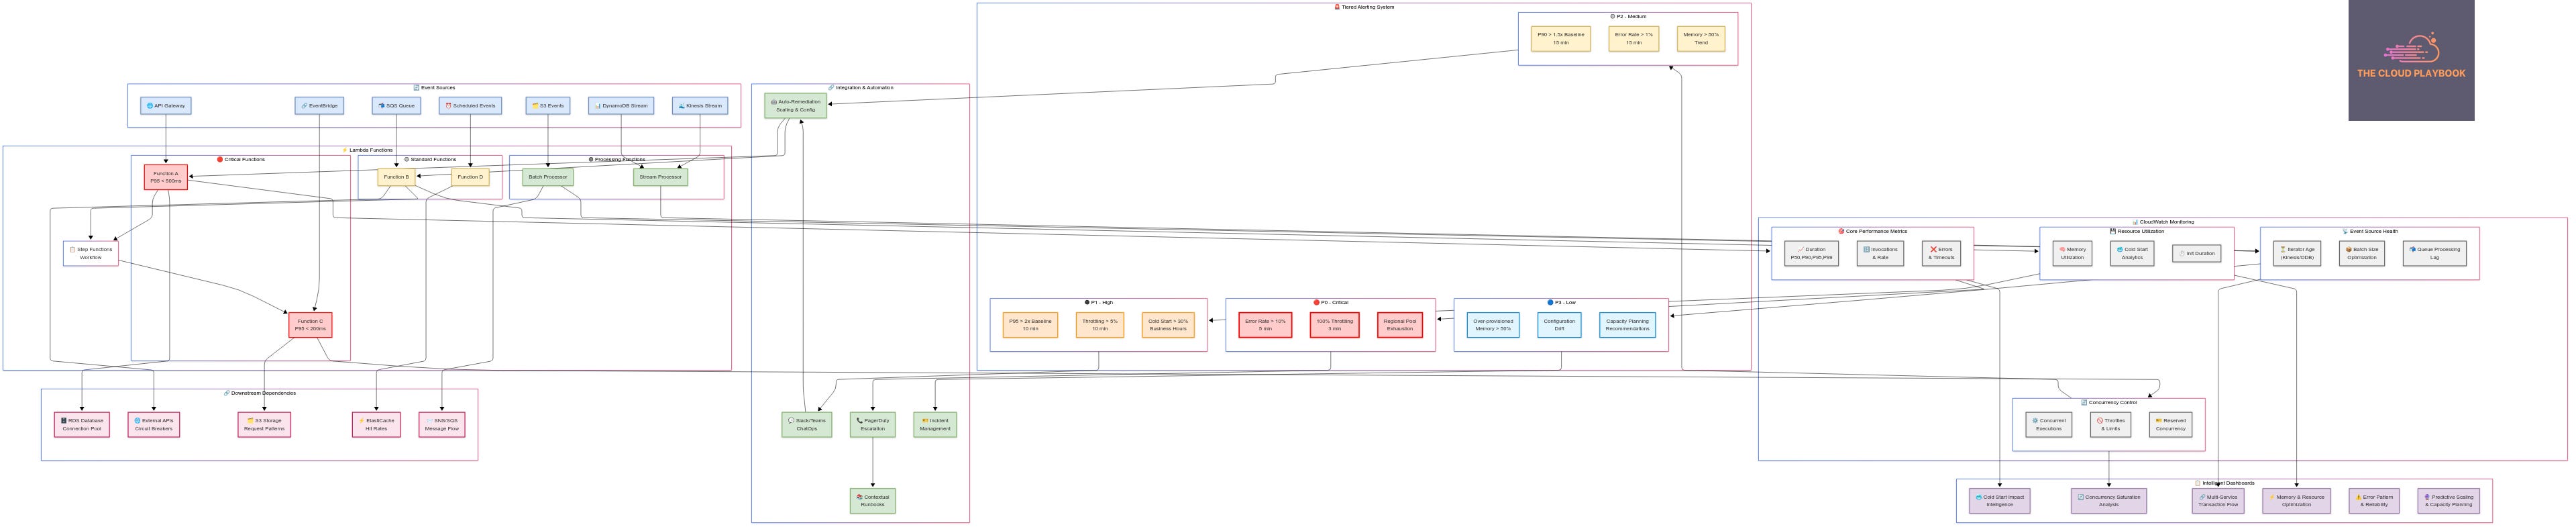
Part 1: The Critical Metrics That Matter
Core Performance & Execution Metrics
Duration Percentiles (Not Averages)
P50, P90, P95, P99 – Track latency distribution, not just means
Why it matters: A 100ms P50 with a 5000ms P99 indicates severe cold start problems
Action: Set alerts on P95 > 2x baseline to catch performance degradation early
Invocation Patterns
Total invocation count and rate – Essential for capacity planning
Burst detection: Monitor invocation rate changes > 300% in 5-minute windows
Traffic velocity: Track invocations per second trends to predict scaling needs
The Throttling Trinity
Throttles – Concurrent execution limit breaches (your canary in the coal mine)
ConcurrentExecutions – Real-time execution tracking
UnreservedConcurrentExecutions – Your available concurrency pool buffer
Resource Utilization Intelligence
Memory Optimization Metrics
MemoryUtilization vs MaxMemoryUsed – Identify over/under-provisioned functions
Cost impact: Over-provisioned memory can increase costs by 40-60% unnecessarily
Sweet spot: Target 70-80% memory utilization for optimal cost-performance
Cold Start Deep Dive
InitDuration – Track cold start initialization times
PostRuntimeExtensionsDuration – Monitor extension overhead
Pattern recognition: Cold starts often correlate with deployment frequency and traffic gaps
Event Source & Integration Health
Queue Processing Efficiency
EventSourceMappingBatchSize – Optimize batch processing for throughput
ReceiveCount – Monitor SQS message processing attempts (detect poison messages)
ApproximateAgeOfOldestMessage – Critical for real-time processing requirements
Stream Processing Optimization
IteratorAge – For Kinesis/DynamoDB Streams (target < 1000ms for real-time processing)
EventSourceMappingParallelizationFactor – Kinesis shard processing efficiency
Part 2: Game-Changing Dashboard Strategies
1. Cold Start Impact Intelligence Dashboard
Build This View: Create a comprehensive cold start analysis combining:
Cold start frequency correlated with traffic patterns
Initialization duration breakdown by runtime and dependencies
Performance delta between cold vs warm invocations
Provisioned concurrency ROI analysis
Implementation Tip:
# CloudWatch Dashboard Widget Example
ColdStartAnalysis:
  Type: AWS::CloudWatch::Dashboard
  Properties:
    DashboardBody: !Sub |
      {
        "widgets": [
          {
            "type": "metric",
            "properties": {
              "metrics": [
                ["AWS/Lambda", "InitDuration", "FunctionName", "${FunctionName}"],
                [".", "Duration", ".", "."],
                [".", "Invocations", ".", "."]
              ],
              "period": 300,
              "stat": "Average",
              "region": "us-east-1",
              "title": "Cold Start Impact Analysis"
            }
          }
        ]
      }
Pro Insight: Functions with >50MB deployment packages show 2- 3x longer cold starts. Monitor package size trends alongside init duration.
2. Concurrency Saturation Analysis
Critical Correlations to Track:
Regional concurrency pool utilization vs individual function limits
Throttling cascade effects across dependent functions
Reserved concurrency allocation effectiveness
Error propagation patterns during concurrency exhaustion
Alert Strategy:
Warn at 70% regional concurrency utilization
Critical alert at 85% utilization
Track throttling rates across function dependencies
3. Multi-Service Transaction Flow Correlation
Visualize Lambda in Distributed Context:
API Gateway latency breakdown, including Lambda execution
Step Functions workflow correlation with individual Lambda performance
Database connection pooling efficiency across invocations
External API dependency impact on duration and errors
Advanced Technique: Create service maps that show Lambda functions as nodes, with latency and error rate edge weights.
Part 3: Production-Grade Alerting That Works
Tiered Alert Severity Framework
CRITICAL (P0) - Immediate Response Required:
Function error rate > 10% for 5 minutes
Complete function unavailability (100% throttling for 3 minutes)
Regional concurrency pool exhaustion
DLQ processing failures
HIGH (P1) - Response Within 10 Minutes:
Function duration P95 > 2x baseline for 10 minutes
Throttling rate > 5% for 10 minutes
Cold start percentage > 30% during business hours
Memory utilization > 90% consistently
MEDIUM (P2) - Response Within 30 Minutes:
Function duration P90 > 1.5x baseline for 15 minutes
Error rate > 1% for 15 minutes
Provisioned concurrency spillover > 20%
LOW (P3) - Response Within 2 Hours:
Cost efficiency alerts (over-provisioned memory > 50%)
Performance optimization opportunities
Configuration drift detection
Intelligent Alert Correlation
Multi-Dimensional Alerting: Combine duration, errors, and throttling in composite conditions. Single metric alerts create noise – composite conditions provide a signal.
Traffic-Aware Thresholds: Different alert thresholds for peak vs off-peak periods. Your 9 AM threshold shouldn't be the same as your 3 AM threshold.
Cascade Failure Prevention: Alert on upstream service degradation before it impacts Lambda. Monitor API Gateway throttling, RDS connection exhaustion, and external service timeouts.
Advanced Alert Enrichment
Automatic Root Cause Suggestions:
Recent deployment correlation
Dependency health checks
Historical pattern matching
Cost impact analysis
Alert Fatigue Prevention:
Smart alert grouping across function versions
Escalation dampening for known issues
Automatic all-clear notifications
Weekly digest reports for trends
Part 4: Implementation Quick Wins
Week 1: Foundation Setup
Implement P95 duration alerts for all critical functions
Set up concurrency monitoring with regional pool tracking
Create basic cold start dashboard with init duration trends
Week 2: Advanced Correlation
Build error pattern analysis with classification (timeout, OOM, runtime, dependency)
Implement traffic-aware alerting with peak/off-peak thresholds
Set up cost efficiency monitoring for over-provisioned functions
Week 3: Predictive Analytics
Deploy anomaly detection for unusual traffic patterns
Create capacity planning dashboard with growth projections
Implement cascade failure detection across service dependencies
Week 4: Automation & Integration
Connect alerts to ChatOps (Slack/Teams integration)
Set up auto-remediation for common issues (memory adjustments, concurrency scaling)
Build performance baseline updates with dynamic threshold adjustment
Part 5: Advanced Techniques for Variable Traffic
Predictive Scaling Strategies
Traffic Pattern Recognition:
Analyze historical traffic patterns to predict surge timing
Implement predictive provisioned concurrency scaling
Use CloudWatch Events to pre-warm functions before known traffic spikes
Resource Right-Sizing Automation:
# Example: Automated memory optimization based on actual usage

def optimize_lambda_memory(function_name, days=7):
    # Analyze MaxMemoryUsed vs configured memory
    # Recommend optimal memory configuration
    # Account for 20% buffer for traffic spikes
    recommended_memory = int(max_memory_used * 1.2)
    return min(recommended_memory, 10240)  # Cap at 10GB
Edge Case Monitoring
Poison Message Detection: Monitor SQS ReceiveCount > 3 as an indicator of problematic messages that need manual intervention.
VPC Cold Start Impact: Functions in VPCs show 2- 10x longer cold starts. Create separate monitoring thresholds and consider VPC alternatives.
Cross-Region Failover: Monitor regional Lambda quotas and implement cross-region monitoring for disaster recovery scenarios.
Part 6: Cost Optimization Through Monitoring
Memory Efficiency Analysis
The Memory-Performance-Cost Triangle:
Under-provisioned: Slower execution, higher duration costs
Over-provisioned: Faster execution, higher memory costs
Sweet spot: 70-80% memory utilization with acceptable performance
Provisioned Concurrency ROI: Track cost per improved millisecond of latency. Provisioned concurrency should reduce P95 latency by >50% to justify the cost.
Architectural Cost Insights
Function Granularity Impact:
Monolithic functions: Higher memory costs, longer cold starts
Micro-functions: More cold starts, higher invocation costs
Monitor both patterns and optimize based on traffic characteristics
Final Thoughts
Lambda monitoring isn't just about catching errors – it's about understanding the complex interplay between traffic patterns, resource allocation, and architectural decisions.
The strategies outlined here transform Lambda from a black box into a well-understood, optimized component of your architecture.
Remember: The goal isn't perfect monitoring – it's actionable insights that prevent issues and optimize performance. Start with the foundation metrics, build intelligence through correlation, and evolve your monitoring as your understanding deepens.
Have questions about implementing these monitoring strategies?
Hit reply and let me know which part you'd like me to elaborate on. I read every response and your feedback shapes future content.
Playbook Store
I offer many free resources. If you haven't already done so, check out my store at Gumroad.
That’s it for today!
Did you enjoy this newsletter issue?
Share with your friends, colleagues, and your favorite social media platform.
Until next week — Amrut
Get in touch
You can find me on LinkedIn or X.
If you would like to request a topic to read, you can contact me directly via LinkedIn or X.